
Judged by what changed after launch.
Selected engagements across our services and sectors. Each one started with a business problem and ended with something running in production, measured against the goal we agreed up front.
01 / Case studies
Real problems, shipped and measured.
A selection of work across sectors and services.
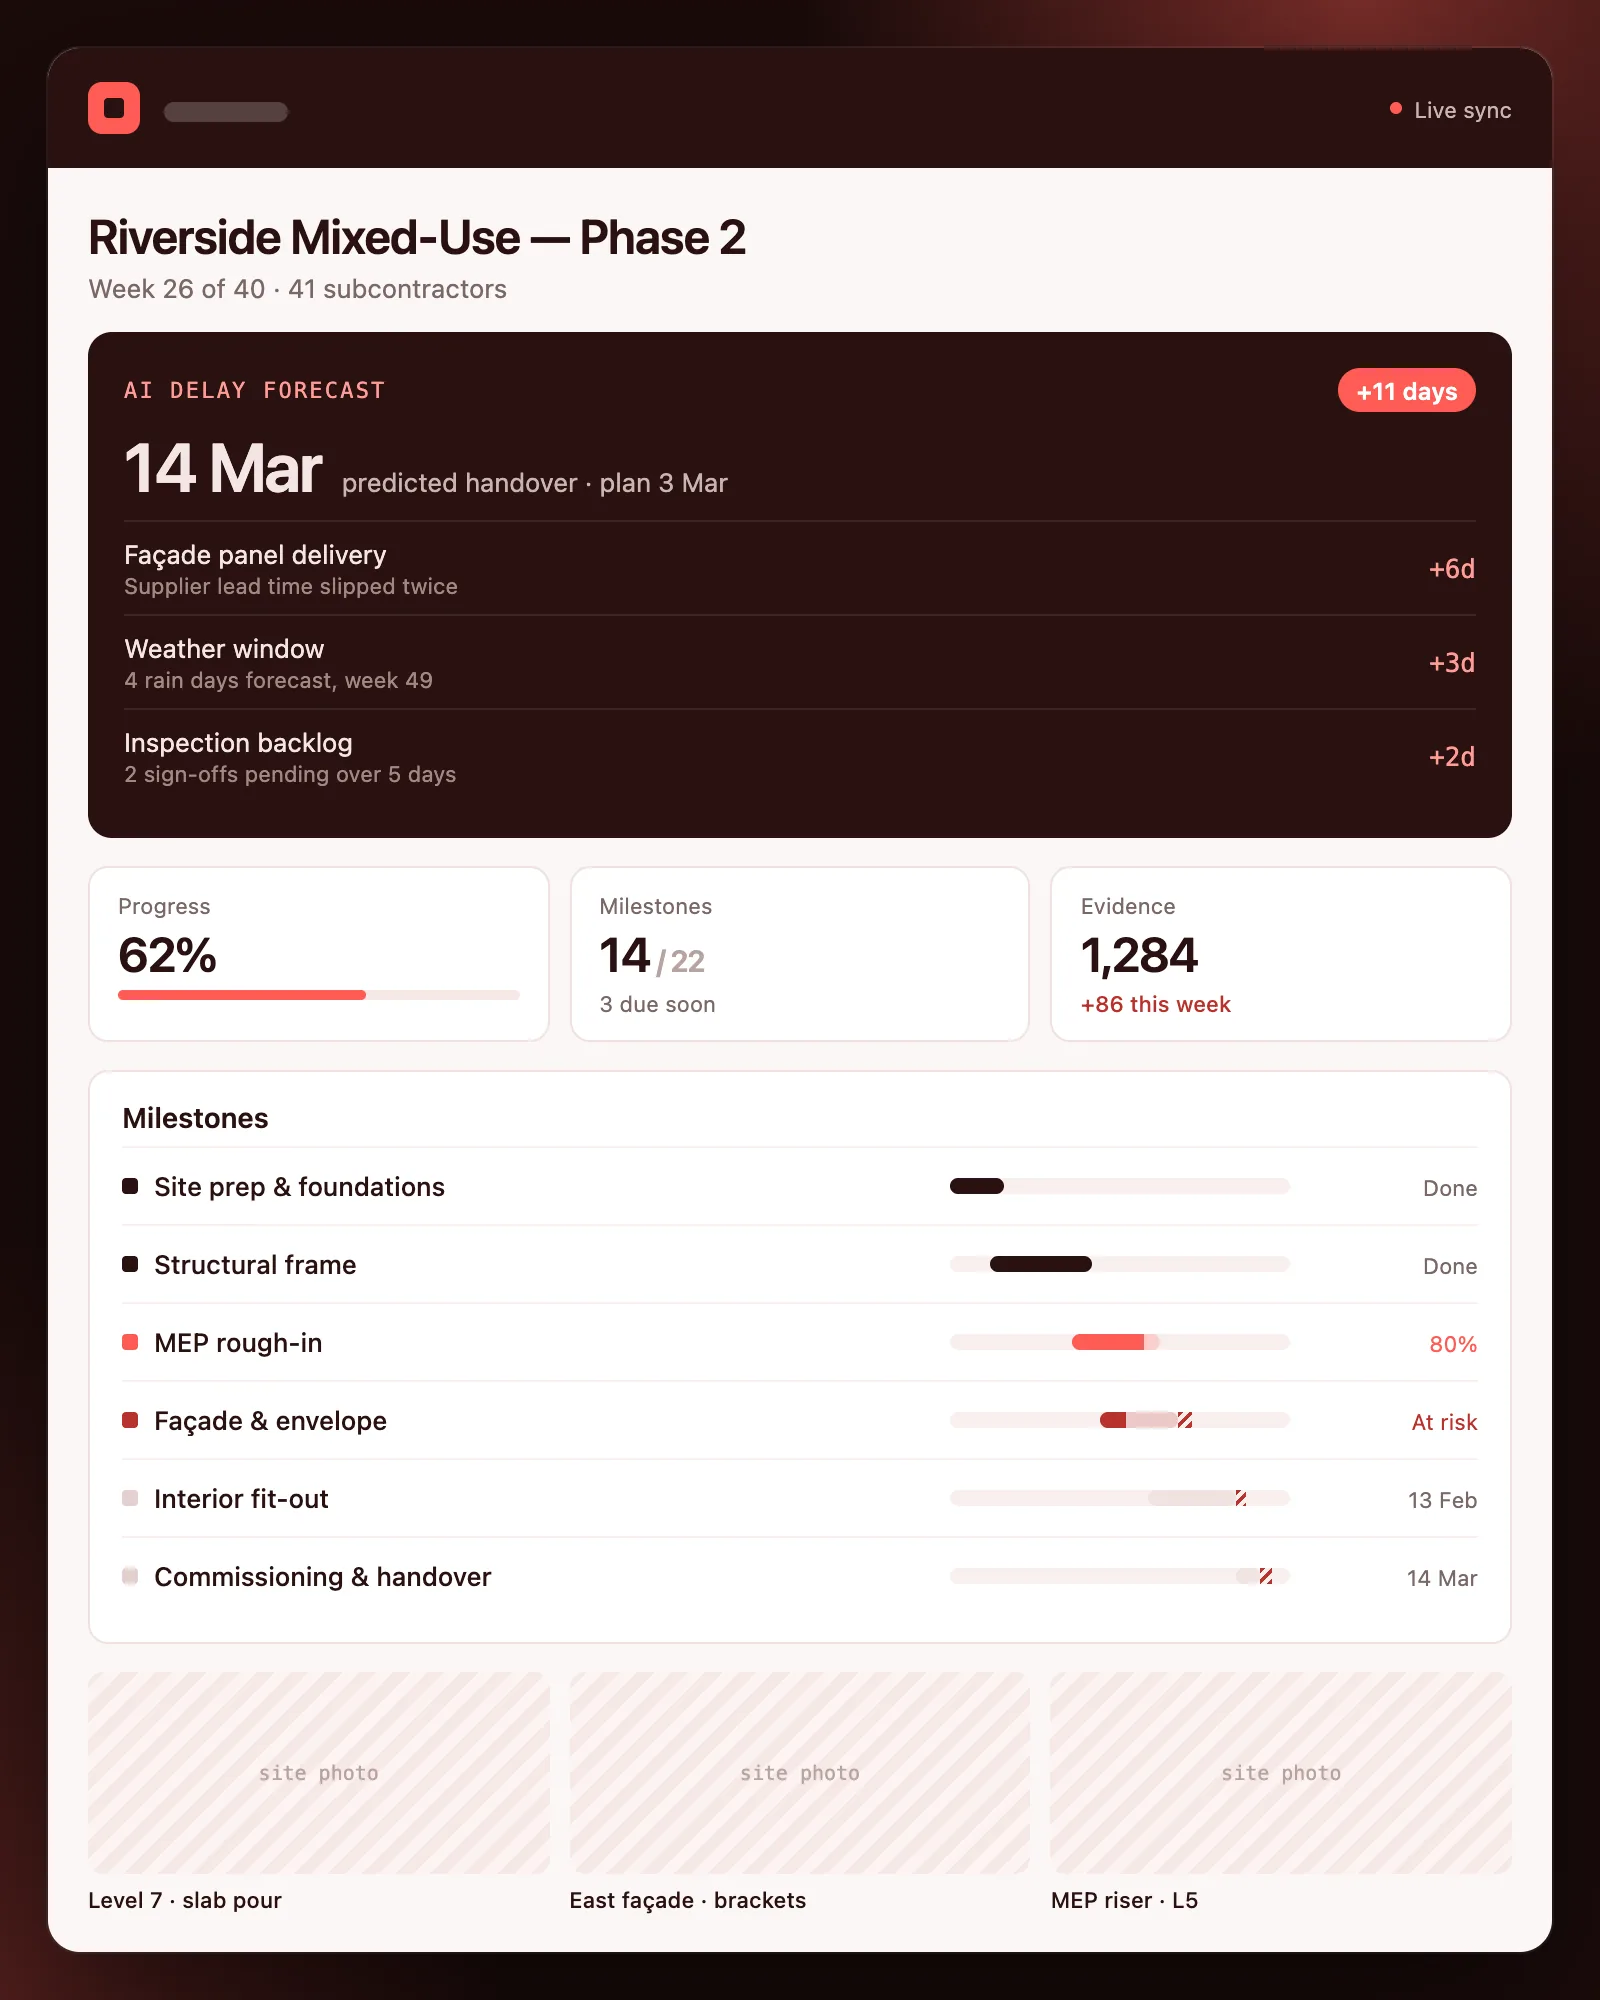
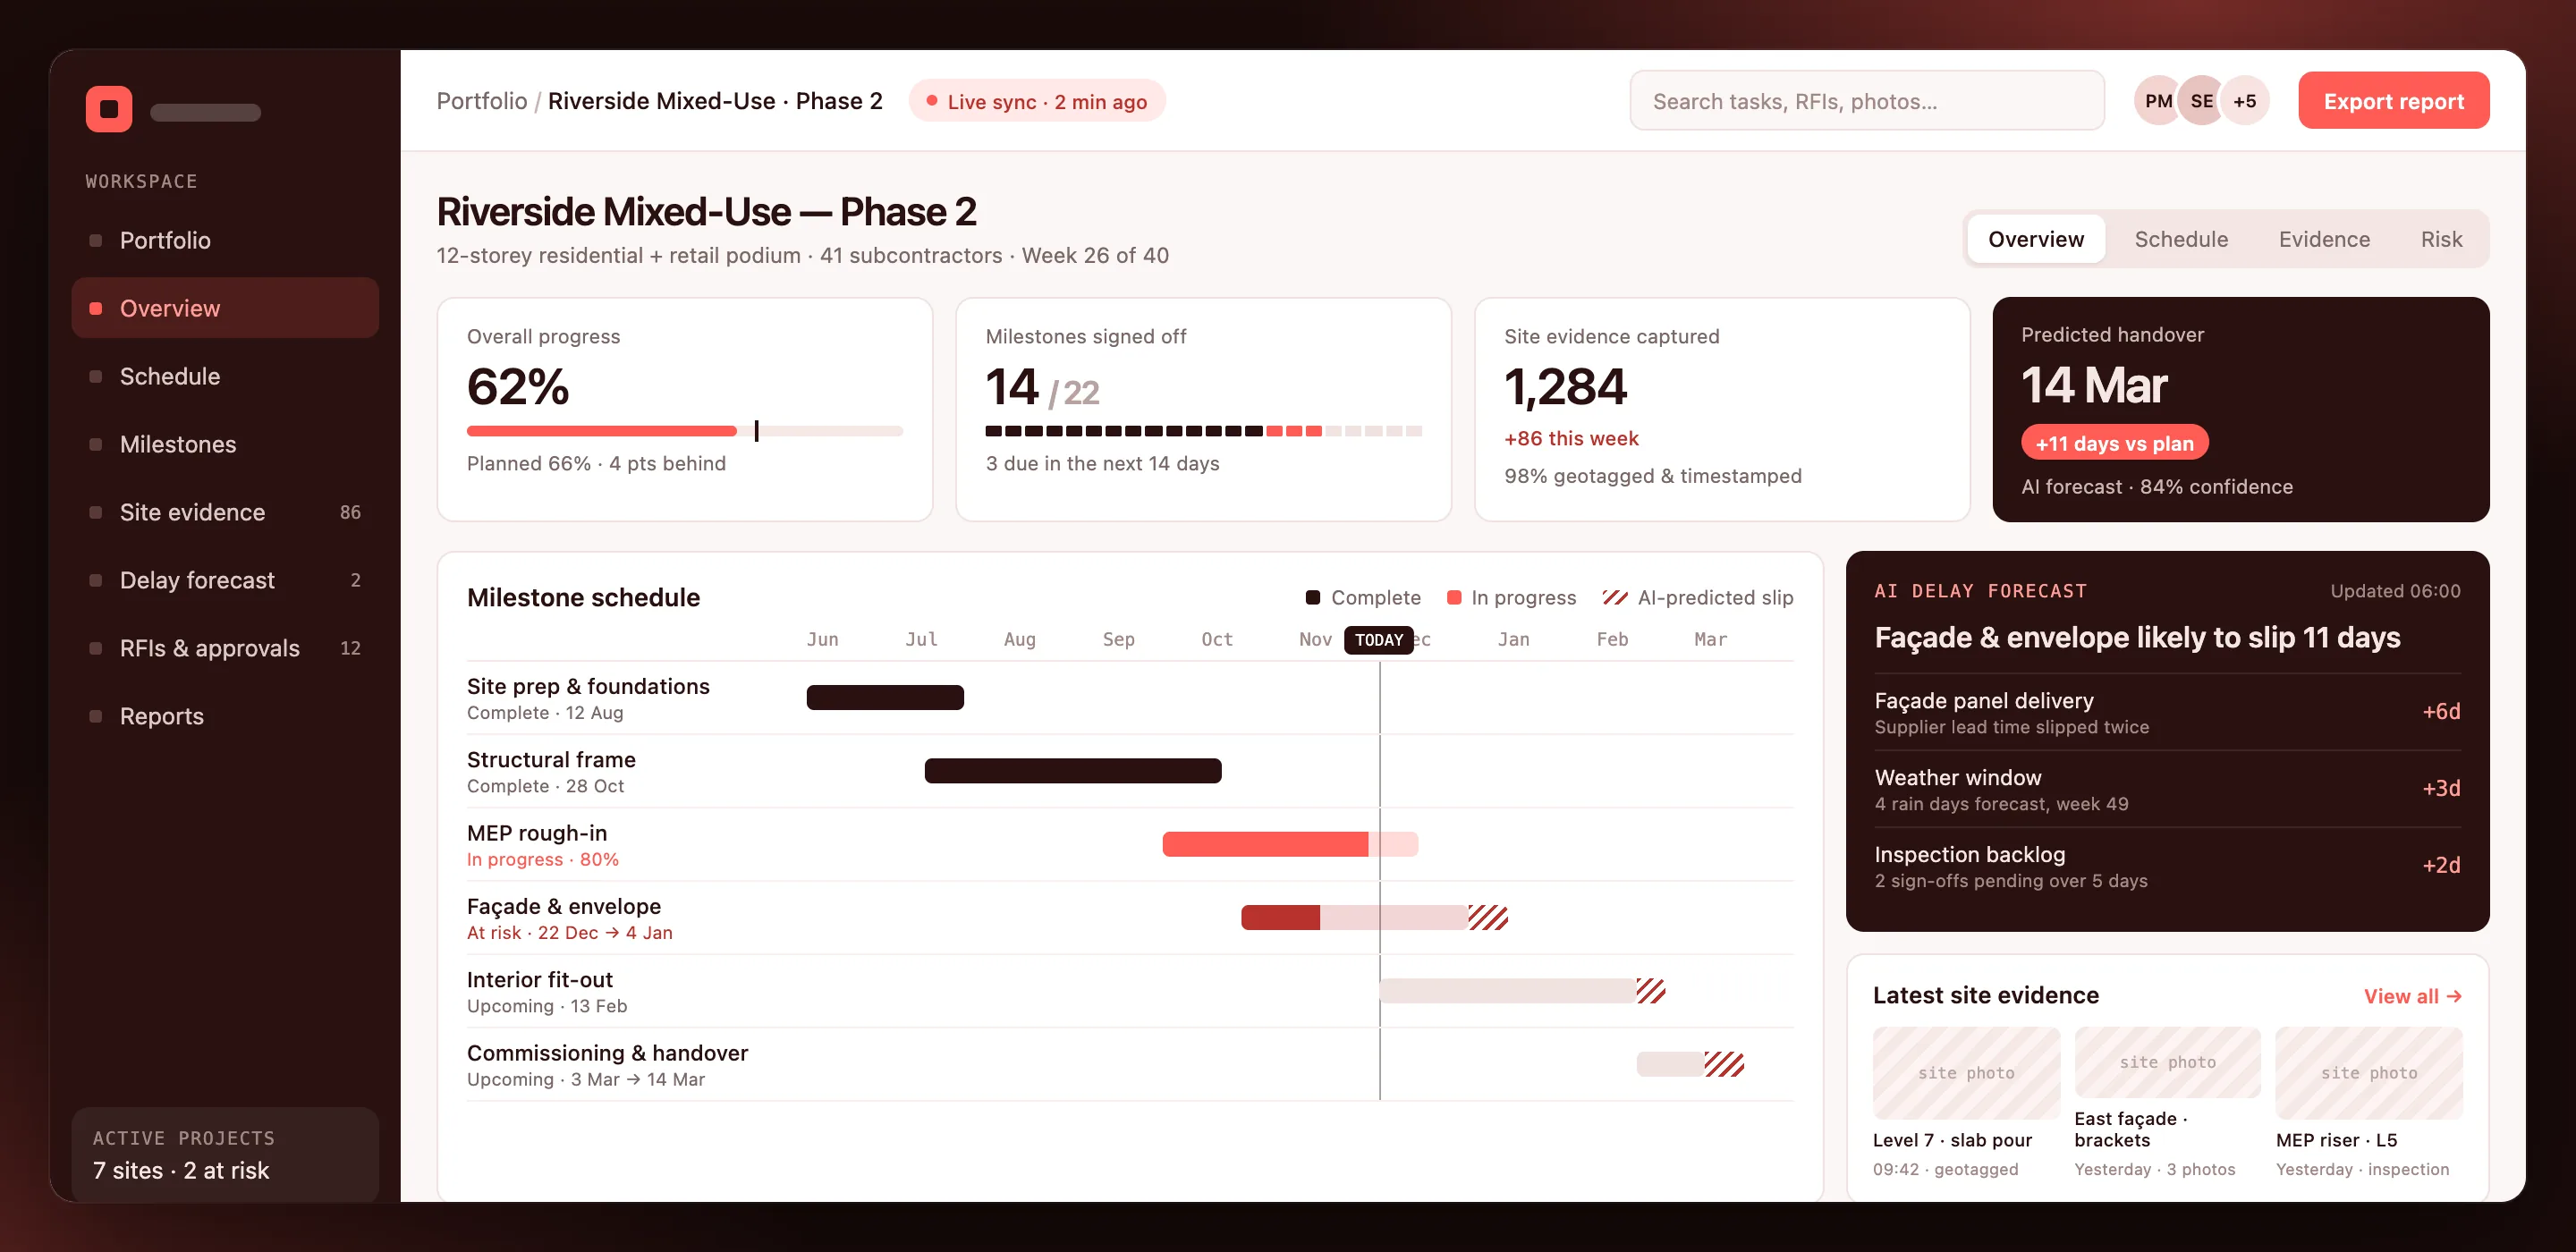
Milestones, site evidence and approvals moved from spreadsheets and chat groups into one platform, with a model that forecasts slip per milestone weeks ahead.
Software Engineering · Data Analytics & BI · Intelligent Automation
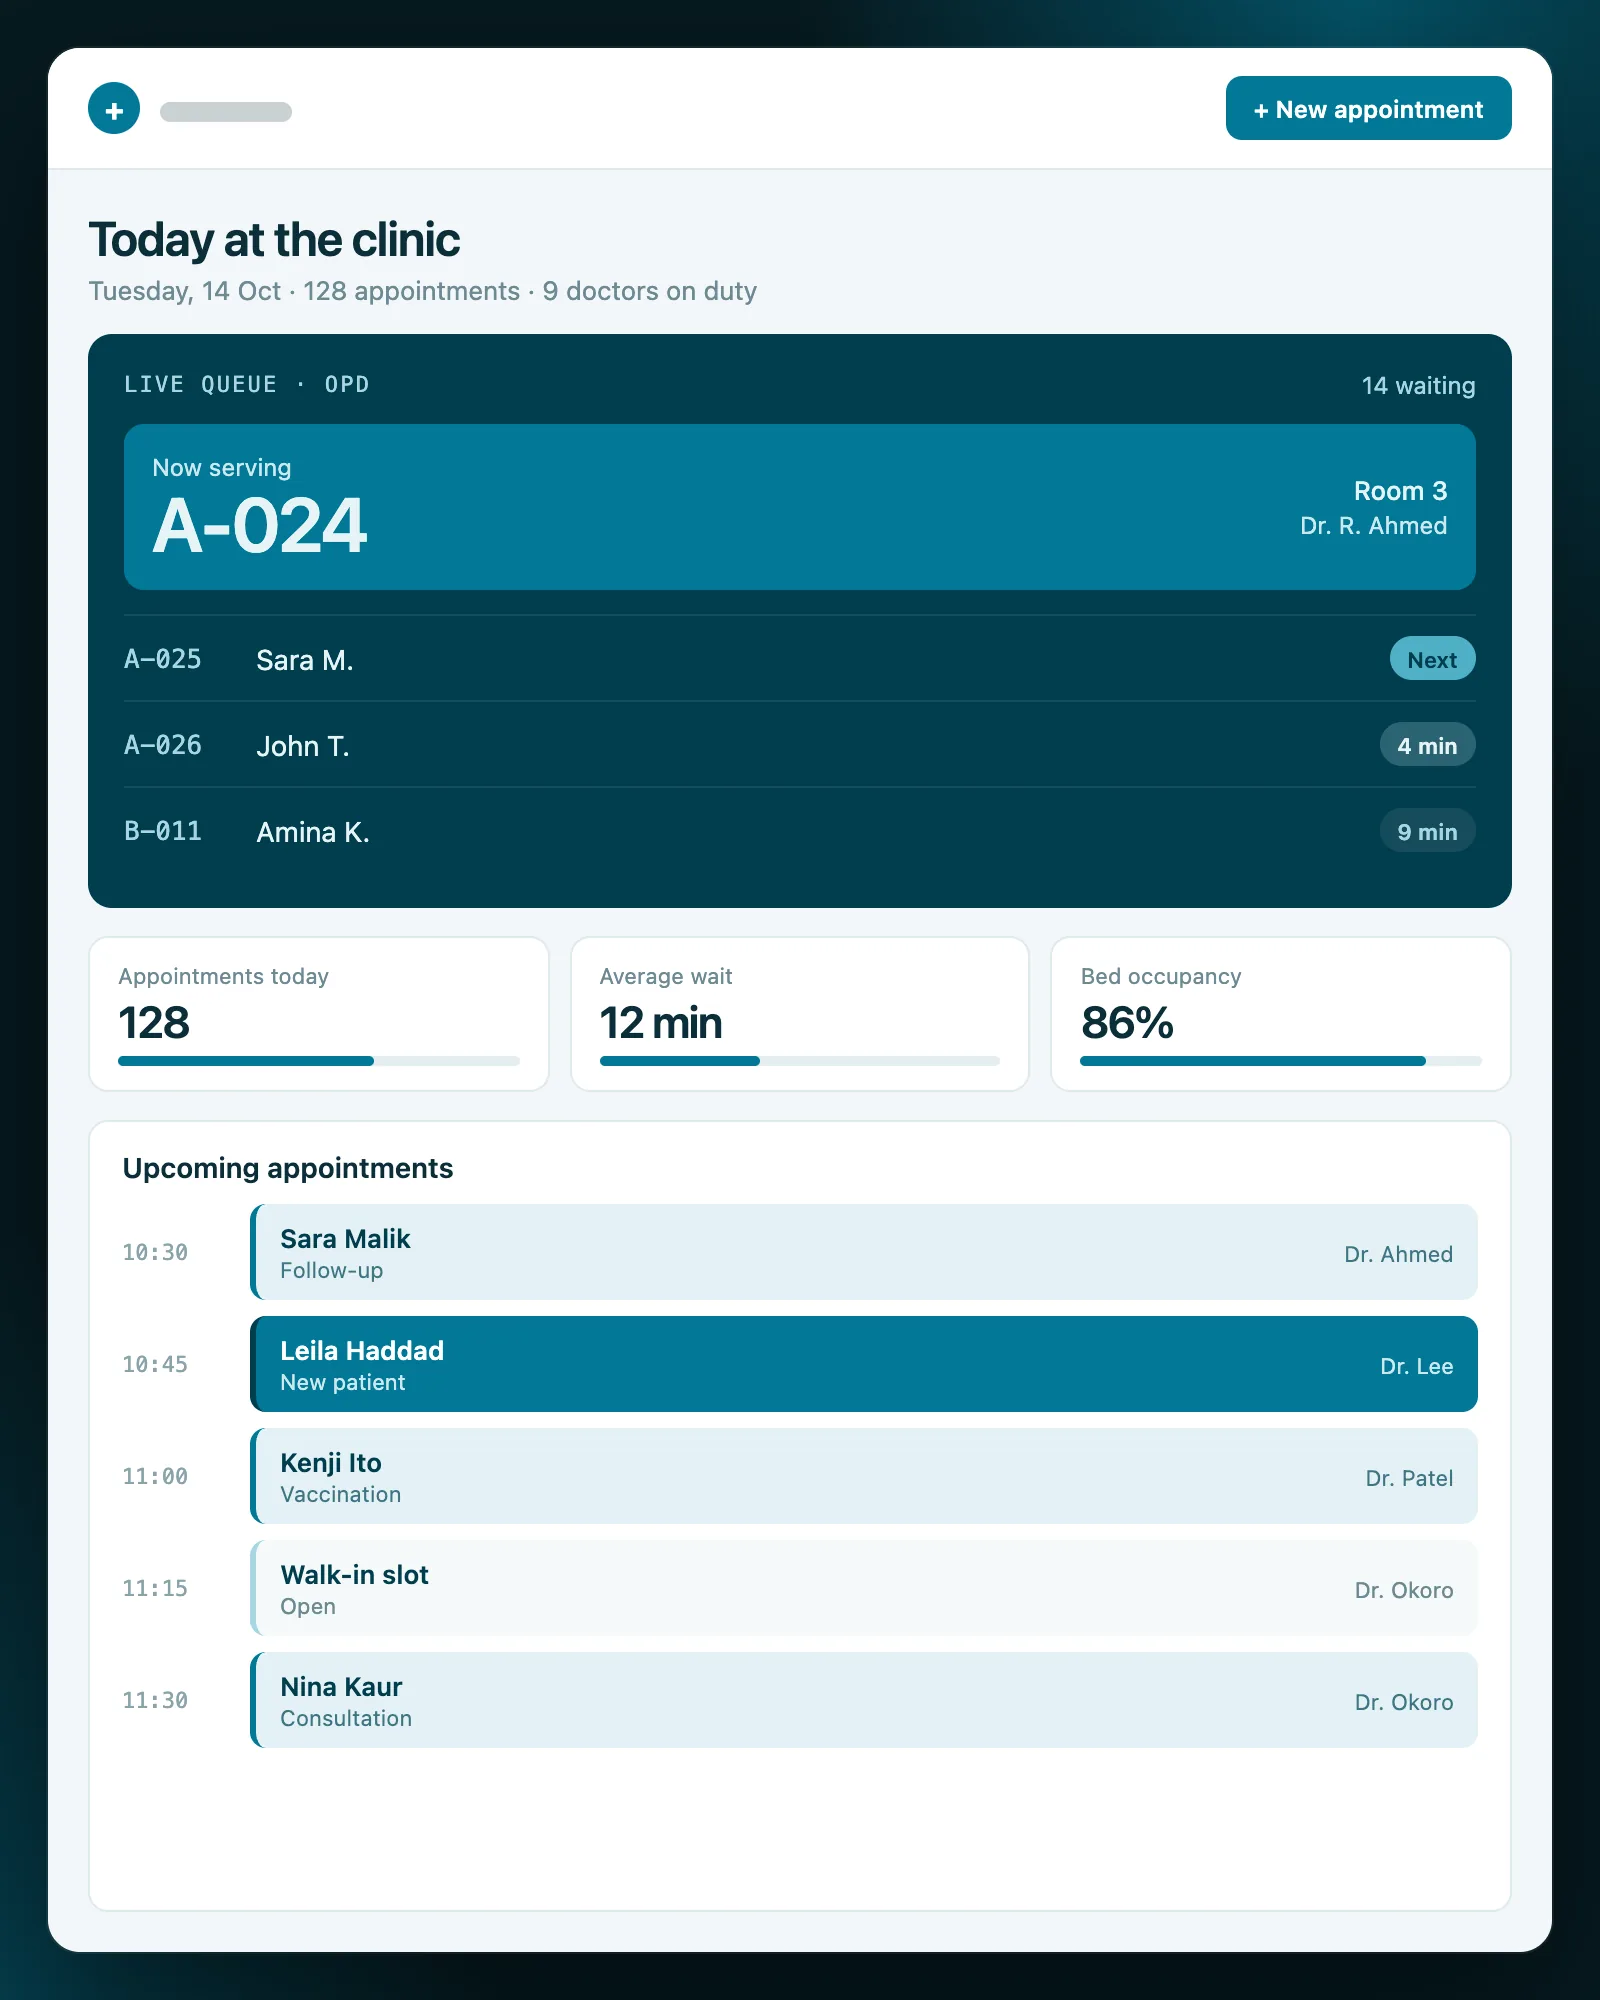
Appointment booking, live patient queues and doctor and patient records brought into one system, so front desks spend less time juggling and patients spend less time waiting.
Software Engineering · Intelligent Automation · Governance, Risk & Compliance
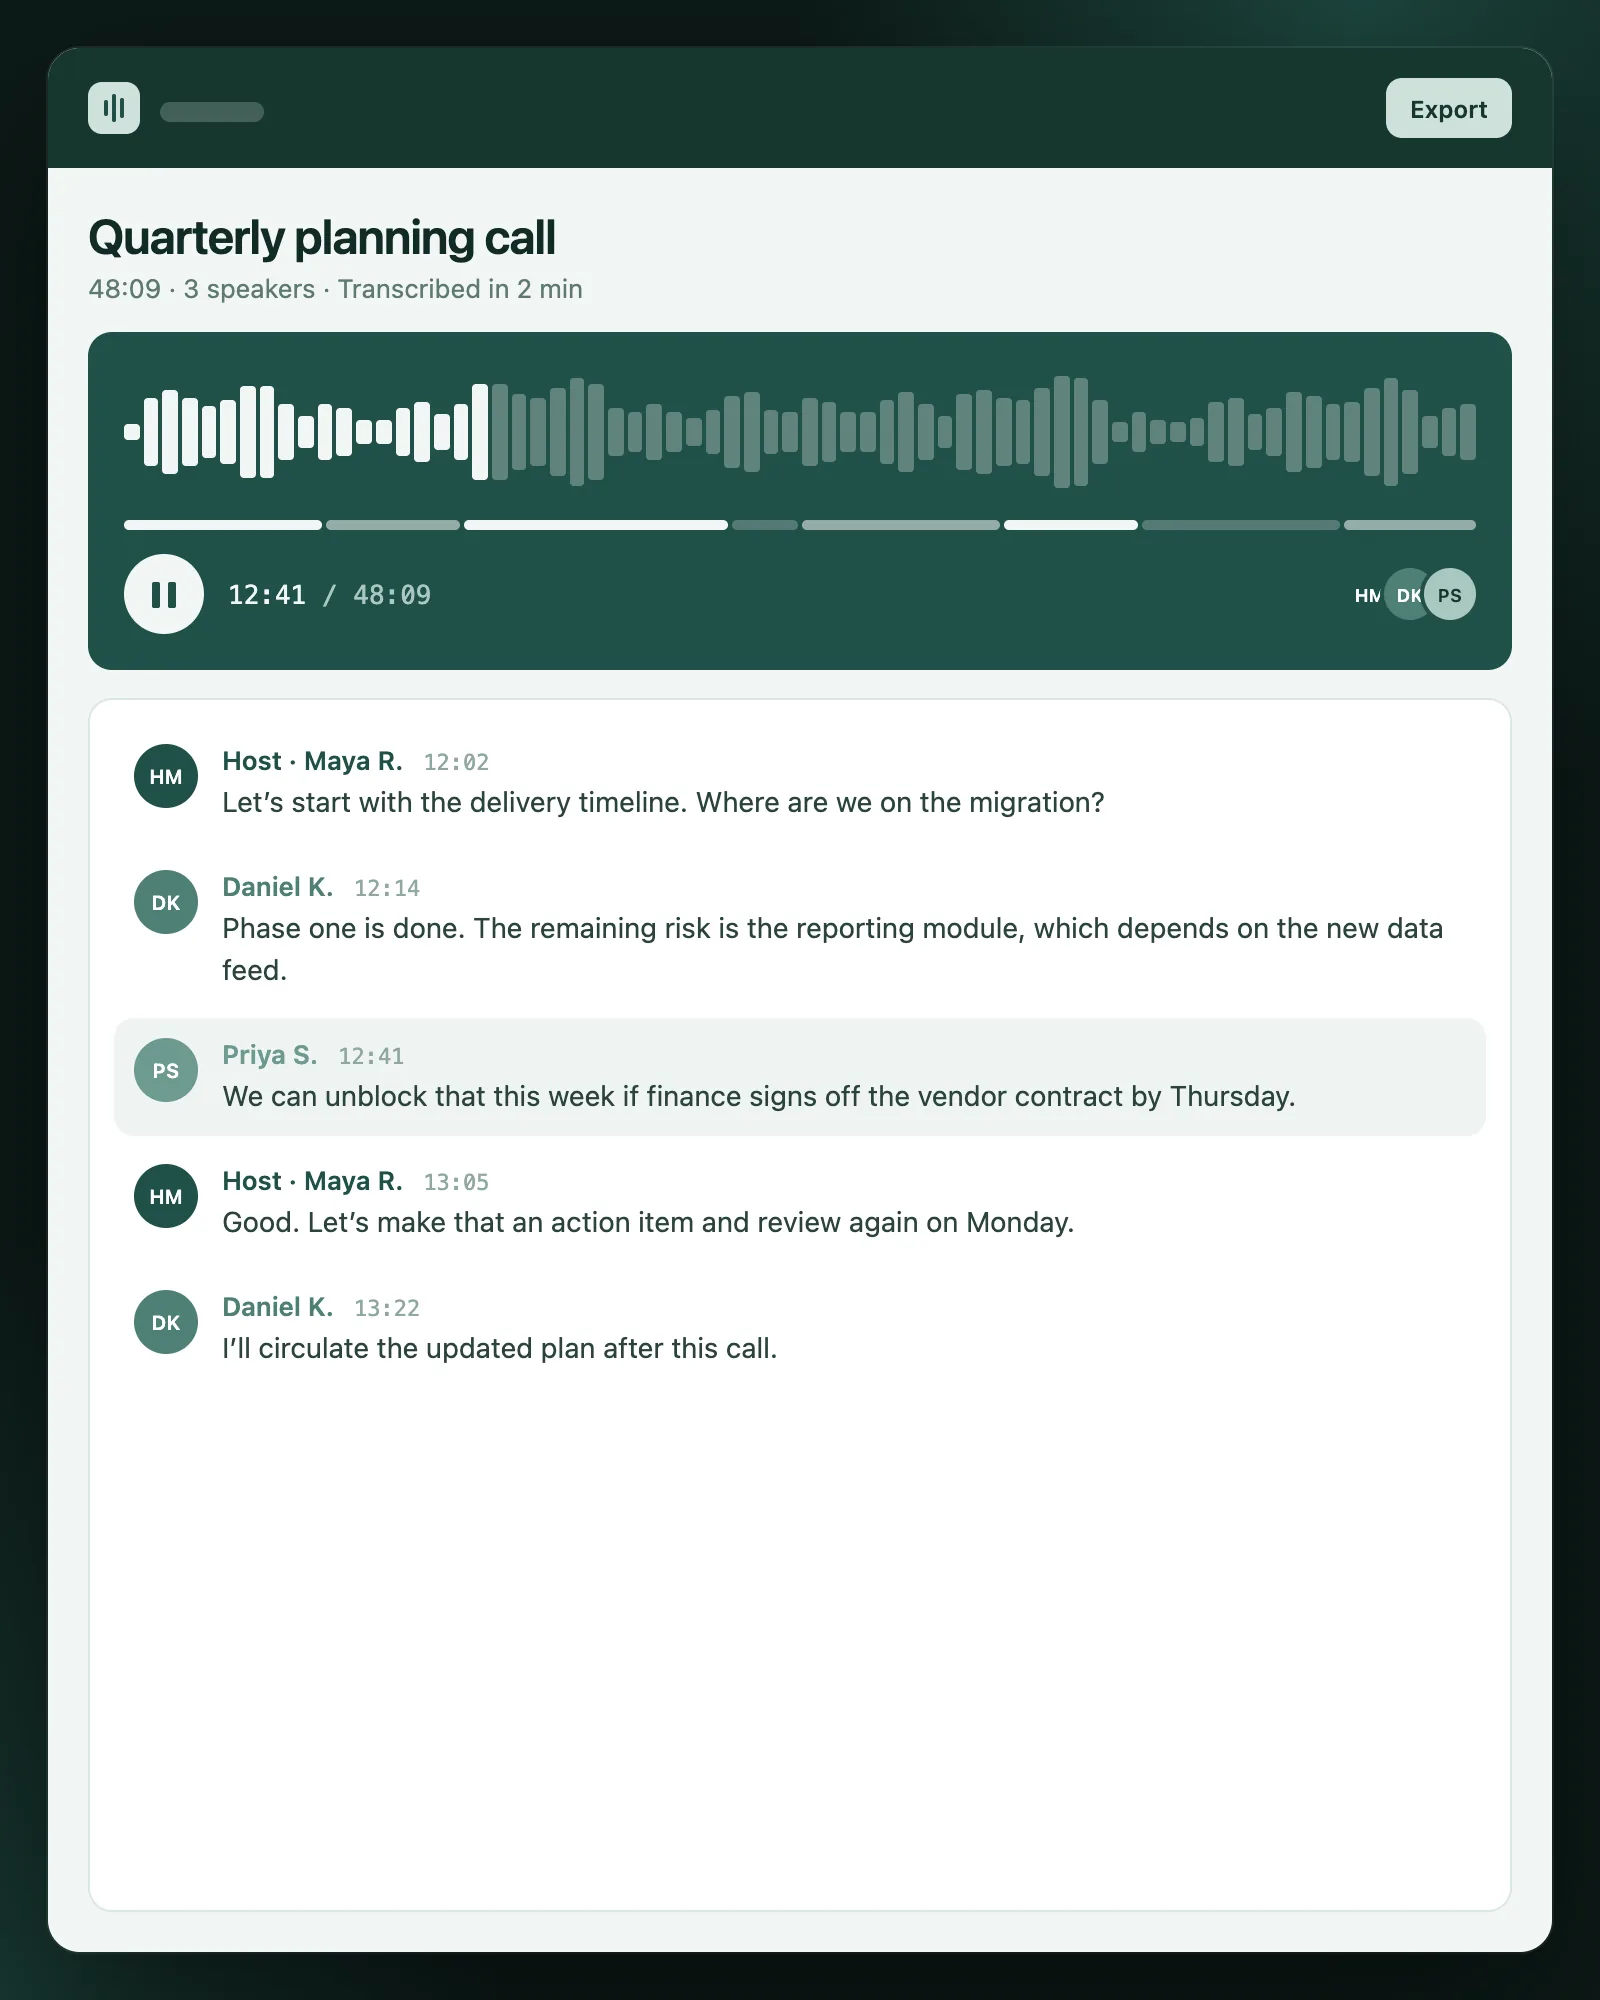
Recordings uploaded, transcribed and split by speaker automatically, with a searchable audio library and AI summaries so teams find what was said without replaying hours of audio.
Software Engineering · Intelligent Automation
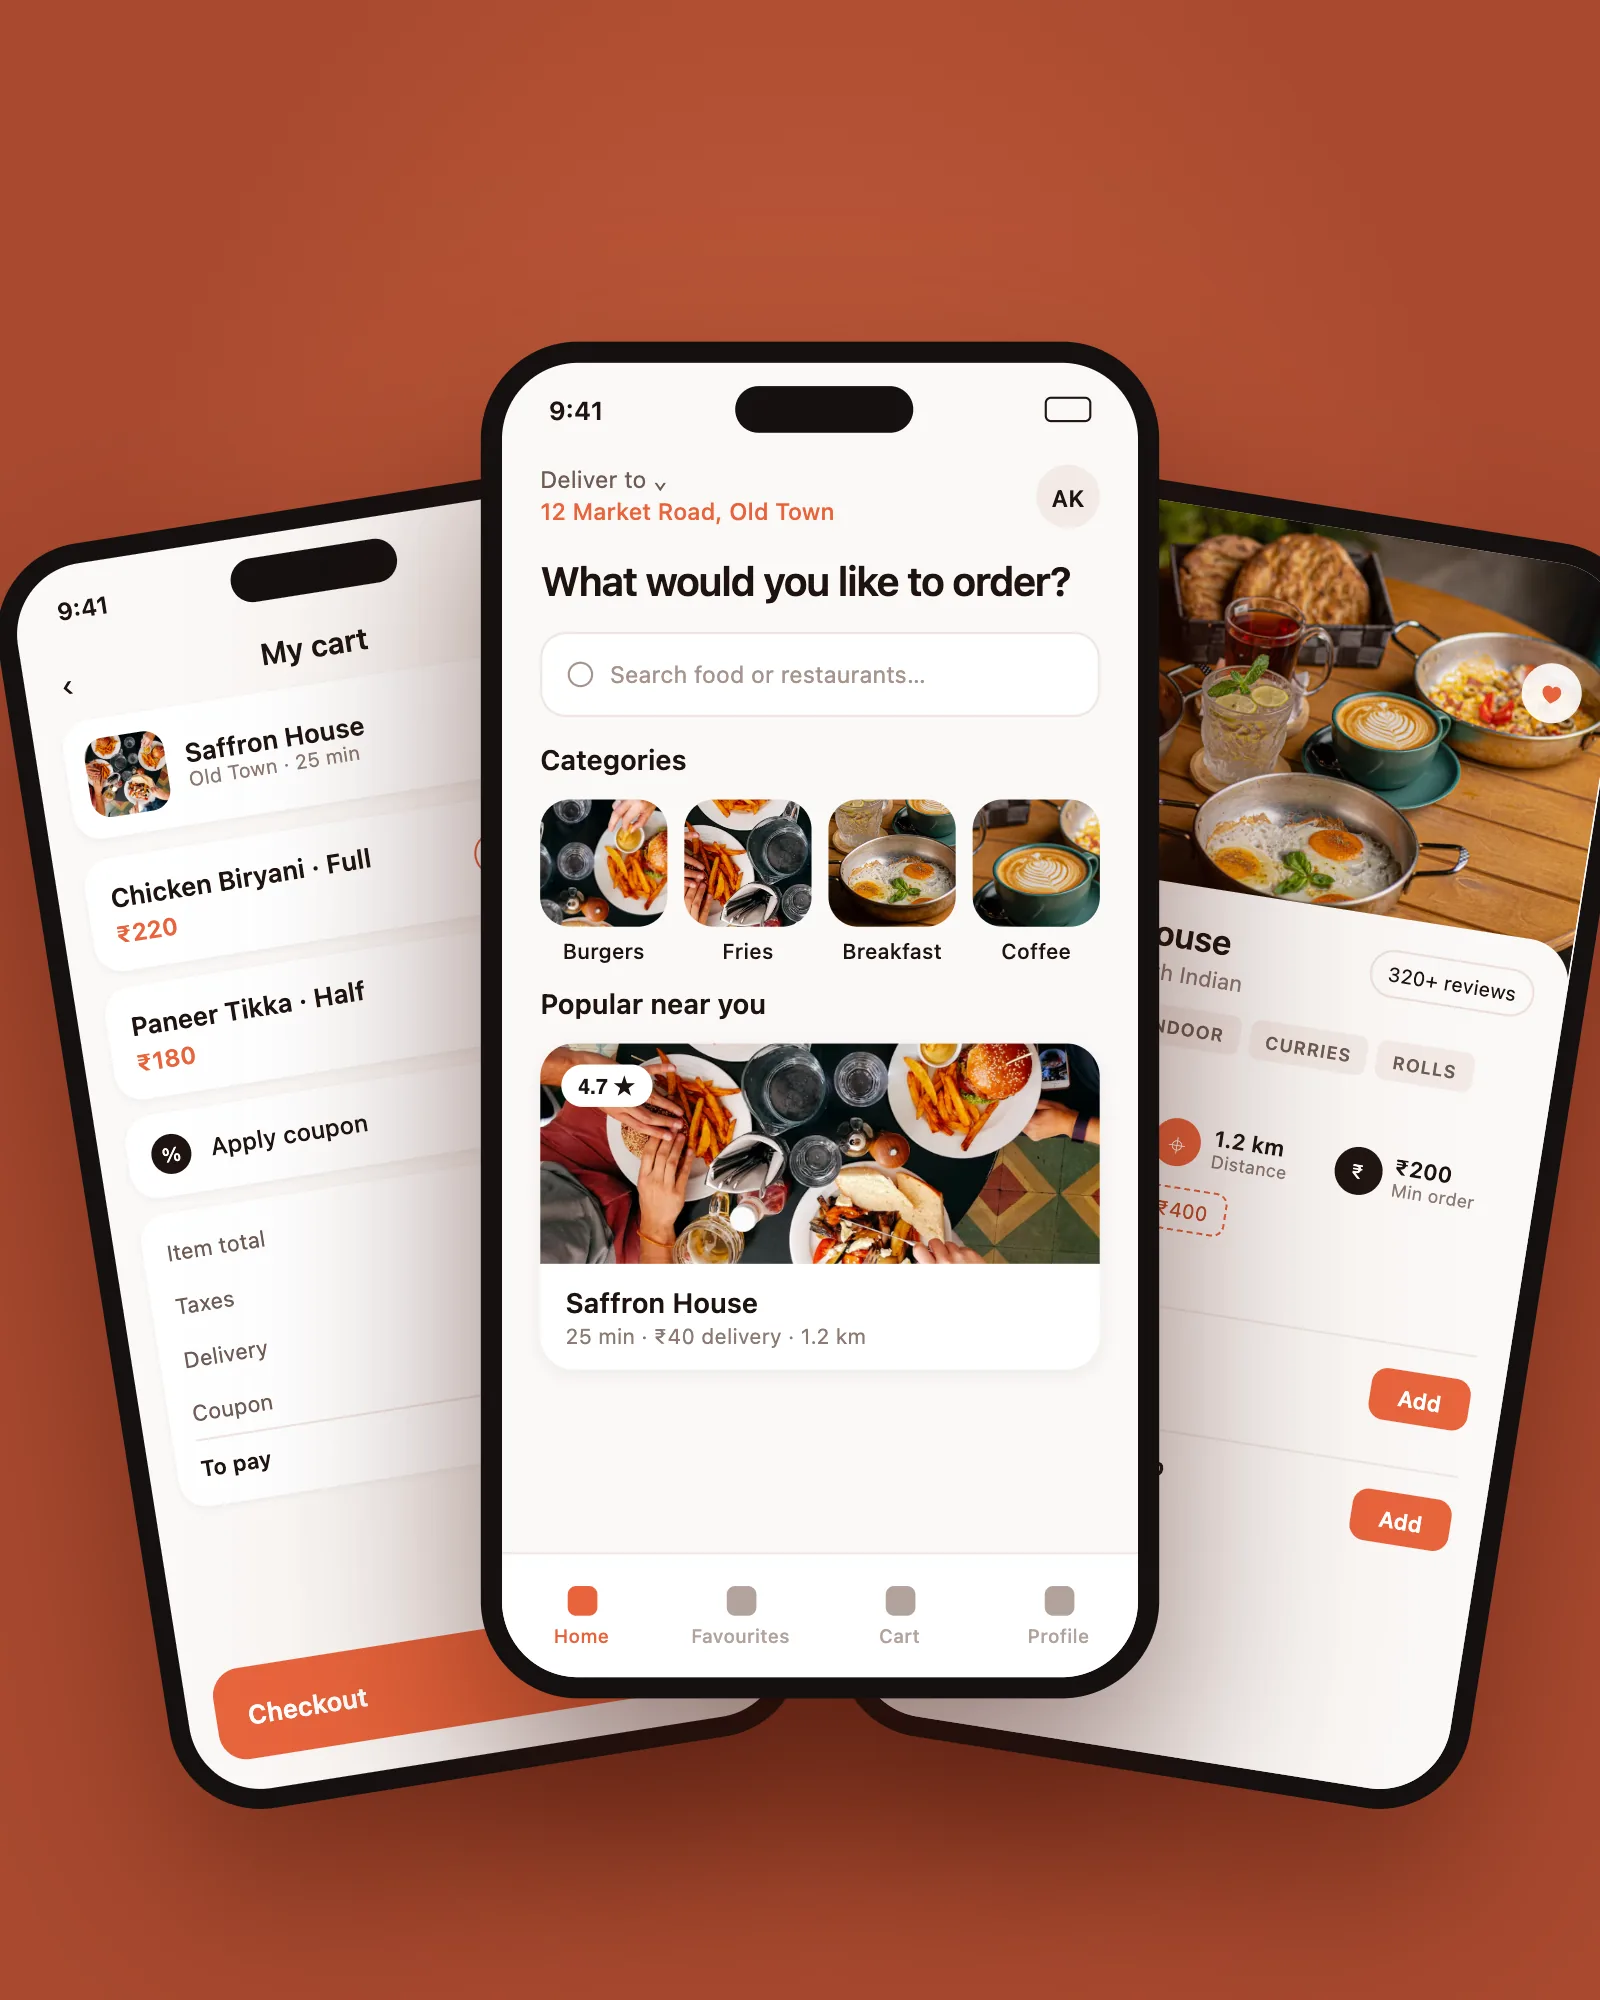
A food delivery platform for online ordering from 200+ restaurants, making it easy to get favourite meals delivered.
Software Engineering
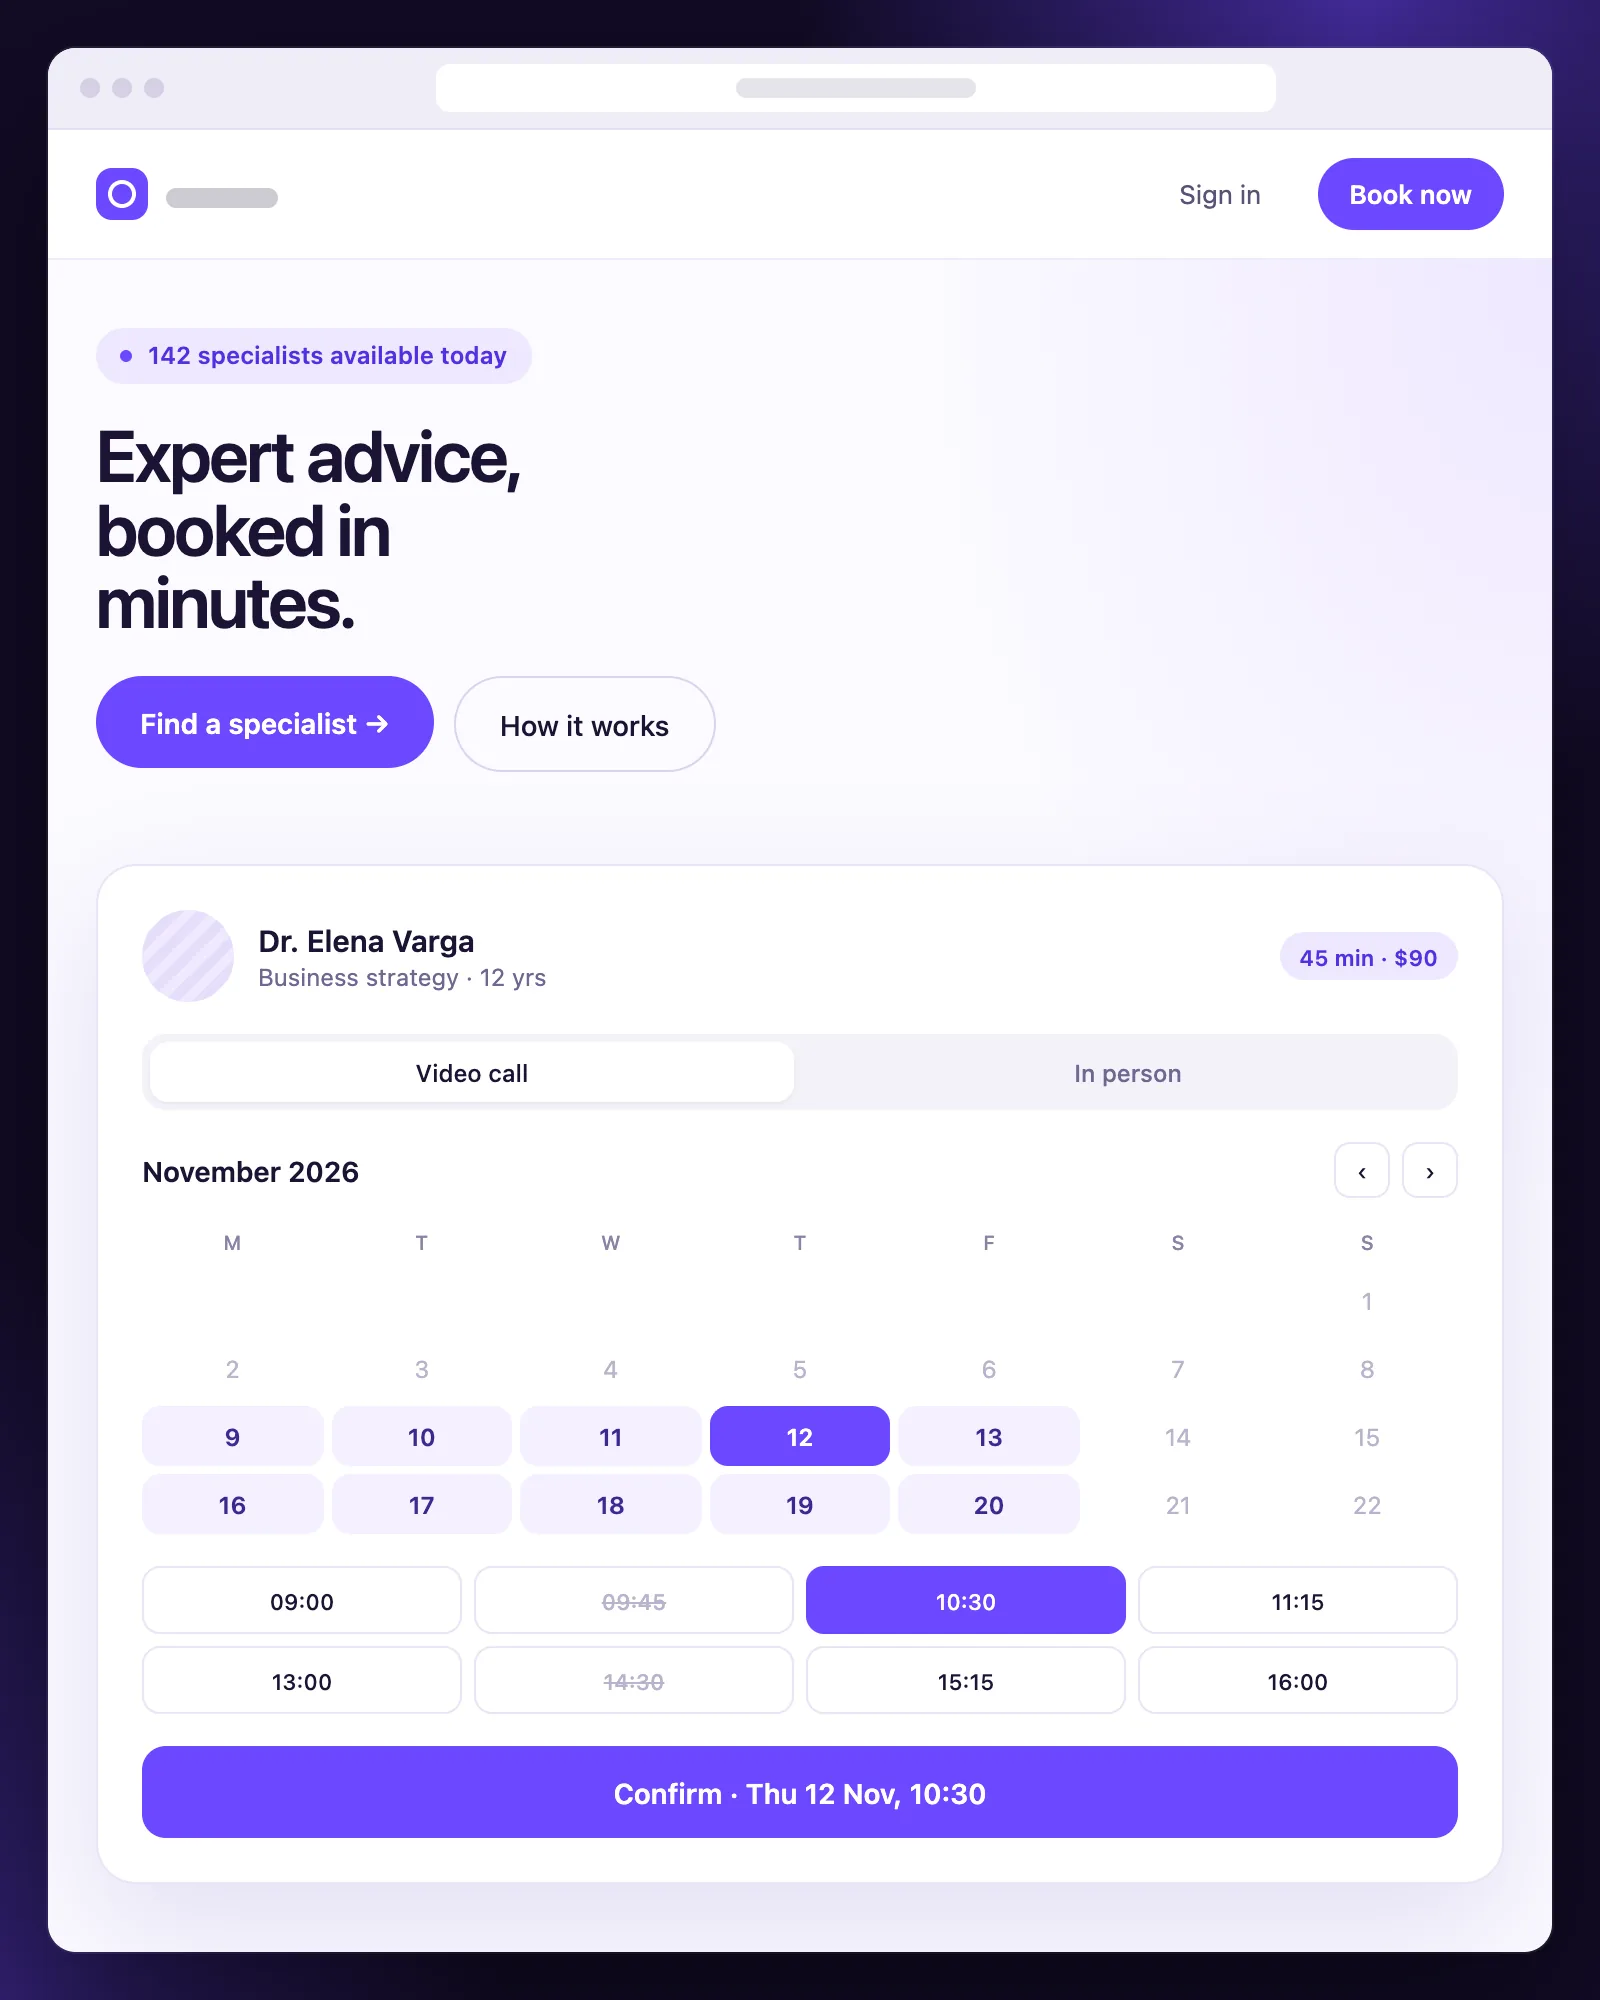
A client-facing website where people find a specialist, pick a live time slot and book and pay for video or in-person consultations online.
Software Engineering · Digital Growth & Marketing
02 / In depth
Construction Management Platform
01Challenge
A general contractor ran multi-site programmes from spreadsheets, with site photos and sign-offs scattered across chat groups. Delays surfaced at the weekly meeting, usually too late to recover.
02Approach
We built one platform for schedules, milestones and geotagged site evidence, integrated with procurement and inspection data, plus a model that forecasts slip per milestone and explains what's driving it.
03Outcome
One source of truth from site to boardroom: milestones, evidence and approvals in one place, with delays surfaced early enough to act on.
“For the first time, our site teams and head office are looking at the same picture. We can see what’s happening on every site, every day, without waiting for someone to send photos or update a spreadsheet.”
03 / Start a conversation
Your project could be the next one here.
Tell us what you're trying to fix. We'll share relevant work, including examples we can't publish, on a short intro call.